await (await fetch("https://ipapi.co/json")).json()Day 2: Lines
Overcoming CORS Challenges: Building a Self-Contained Web Server (O_O) for Day 2 of the 2023 30 Day Map Challenge
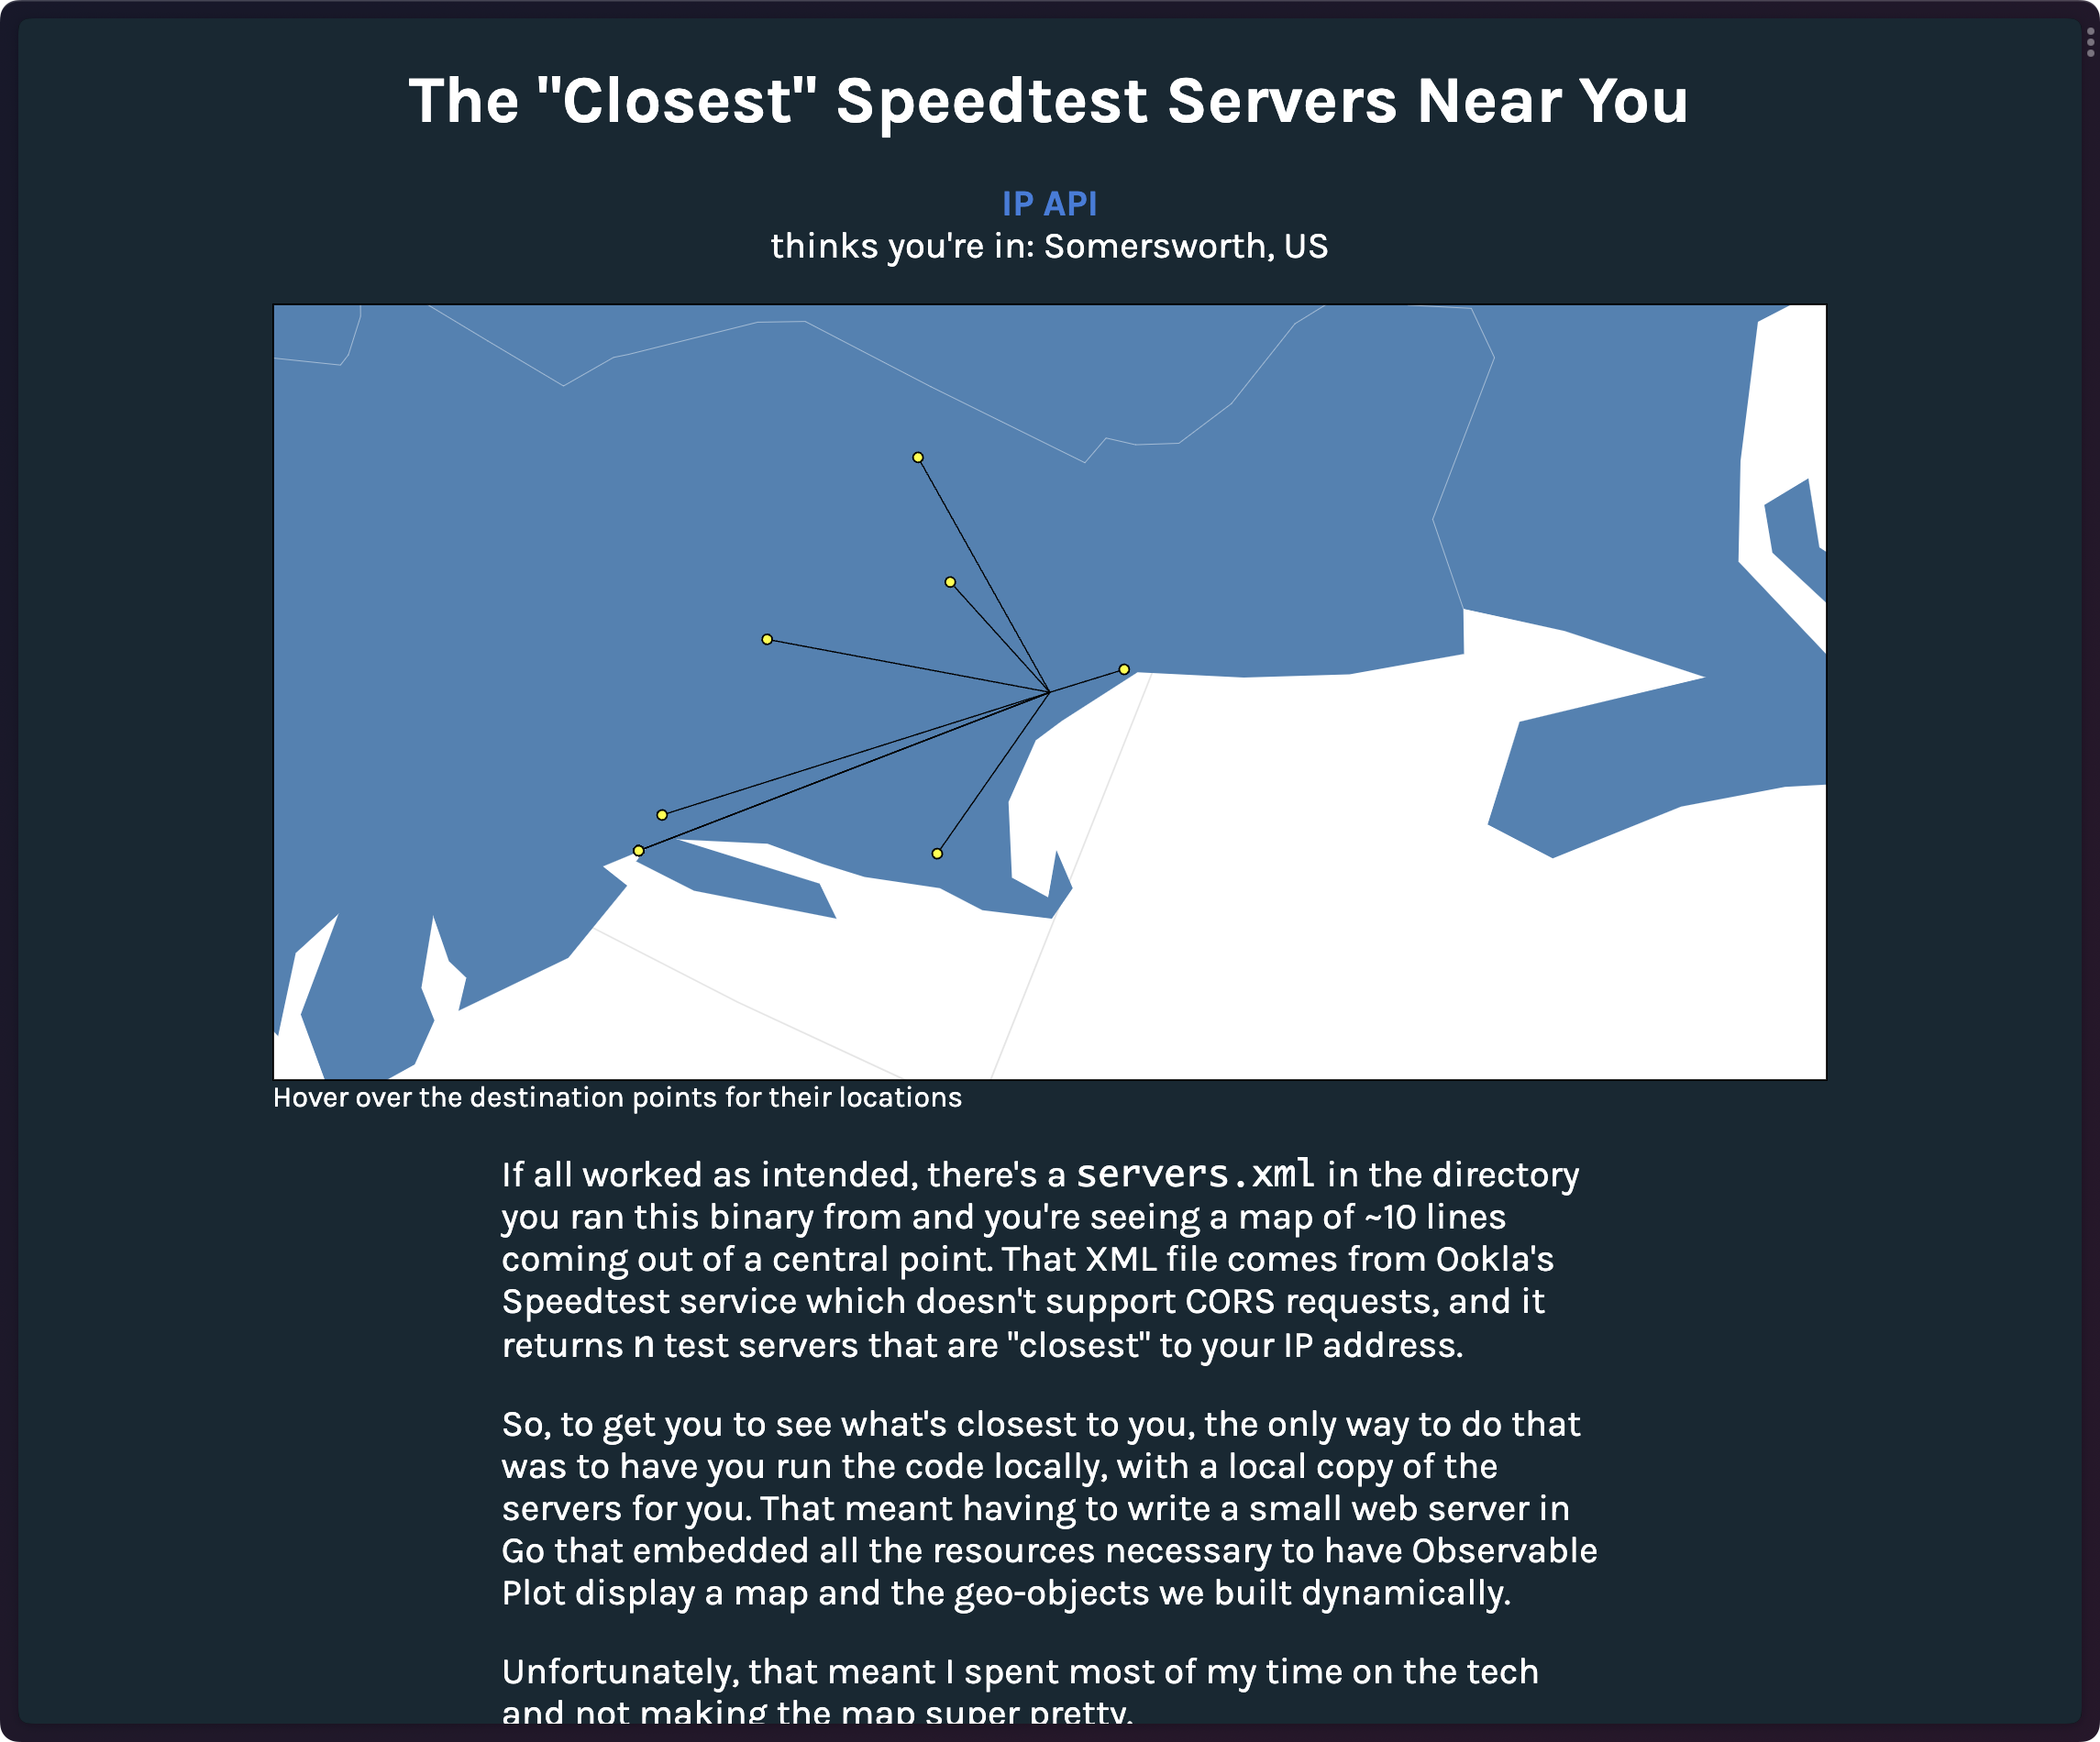
Your friendly neighborhood hrbrmstr got it into his thick noggin’ that — for the “lines” day — he wanted to show a map of the closest Ookla speedtest servers to where someone viewing said datavis was located at.
Getting your pseudo-geolocation is not hard. This is where IP API thinks you are:
They have a generous CORS policy.
Ookla’s https://www.speedtest.net/speedtest-servers-static.php endpoint does not. That means any attempt to yank that in the browser is going to fail miserably. And, using a CORS proxy won’t help since it won’t be using your IP address. And, I don’t trust six-year-old lists of Ookla services in random git repos to be accurate.
What’s even more frustrating is that they use your IP address to return a list of ~10 “closest” servers. Meaning, that I can’t just download their whole list and do my own “nearest” checker. So rude.
What truly needed to happen for this vis idea to work is that everyone either needed to have the tooling locally to build a Quarto, R, Python, etc. vis workflow I wrote, or I’d have to figure out a way to self-contain the whole thing. I mean, I guess I could have picked something else to use for “lines” day, but this was in my head. I was “on the jazz”, as the A-Team was wont to say.
Figuring Out The Best Path (Heh) Forward
There was no way I was going to try to force folks to run code or upload data, so the only course of action was to build some binary that y’all could run locally that would:
- download the
servers.xmlgenerated by Ookla’s PHP script - start a web server
- auto-open your browser to the localhost and port to see the vis.
I made an initial foray into trying to use Redbean for this since it would have indeed resulted in a solitary binary. That dead-ended pretty quickly, mostly due to my lack of familiarity with the gory details of the embedded lua and the powerful unix module, and making it all work in time.
So, I turned to my default language for building small, portable web servers: Go.
You can skip right to the source, if you like.
Golang has a lovely embed module that lets you, well, embed static resources into a built Go binary by storing them in objects you can reference elsewhere in the code.
I used that to embed the well-worn countries-110m.json into the binary, along with an index.html file and my favicon.ico (I despise easily avoidable browser console log errors). I could have just referenced that file in an import, but I’m already importing more CDN-backed JS libraries thatn I like to.
There was no need to add the complexity of an exteral HTTP router module when we just have a couple routes. In the code, below, /, /favicon.ico, and /countries-110m.json are all served up from memory, so the load super fast. If 8080 is taken on your system, you’ll just set the PORT env variable to a free one before running the binary.`
func startServer() {
    http.Handle("/", http.FileServer(http.FS(content)))
    http.Handle("/favicon.ico", http.FileServer(http.FS(favicon)))
    http.Handle("/countries-110m.json", http.FileServer(http.FS(countries)))
    http.HandleFunc("/servers.xml", func(w http.ResponseWriter, r *http.Request) {
        http.ServeFile(w, r, "servers.xml")
    })
    err := http.ListenAndServe(":8080", nil)
    if err != nil {
        log.Fatal(err)
    }
}
All the real work is done in the embedded index.html. We use some key JS libraries via CDN to help us with the data wrangling and plotting:
import * as d3 from 'https://cdn.jsdelivr.net/npm/d3@7.8.5/+esm'
import * as Plot from "https://cdn.jsdelivr.net/npm/@observablehq/plot@0.6/+esm";
import * as topojson from 'https://cdn.jsdelivr.net/npm/topojson-client@3.1.0/+esm';
The other parts of the wrangling code are not complex, and you may want to poke at it if only to check out how to build some crunchy GeoJSON by hand.
Observable Plot, in a vanilla JS context, does all the core vis work:
// this is our "zoomer"
const circle = d3.geoCircle()
  .center([ +myIp.longitude, +myIp.latitude ])
  .radius(3)();

// the geo mark is super handy
const plot = Plot.plot({
  className: "go",
  caption: "Hover over the destination points for their locations",
  projection: {
    type: "azimuthal-equidistant",
    rotate: [ myIp.latitude, myIp.longitude ],
    domain: circle
  },
  width: 928,
  height: 928 / 2,
  marks: [
    Plot.graticule(),
    Plot.geo(land, { fill: "steelblue" }),
    Plot.geo(countrymesh, { stroke: "white", strokeWidth: 0.25 }),
    Plot.geo(connections, { stroke: "black", strokeWidth: 0.75 }),
    Plot.geo(nodes, {
      stroke: "black",
      fill: "yellow",
      size: 1,
      title: d => d.properties.name
    }),
    Plot.frame()
  ]
})
The circle object lets us “zoom” in to a given point (via domain in the projection). The rotate just moves us to that location.
There are five layers (the “frame” is technically one, too, though), and the one with nodes adds tooltips to the destination servers.
The justfile (build rules/actions like a Makefile) holds some code for building the cross-platform release binaries.
Grab the binary for your OS from the releases or run:
$ go run gitlab.com/hrbrmstr/overcomplicated@latestif you have Go installed.
FIN
While this was a fun diversion, it did mean I had no time to make the map prettier/more functional. I think I’m fine with that trade off, since it this tiny example has me thinking what more can be done to bill cross-platform, single binary web apps with WebR.
I’ve tested this on Windows, Linux, and macOS, and tetherd to my iPhone to also see that it does pick up new servers when it appears I’m coming from a different geoip’d locale. Hit me up if it’s not working for you.